Figures that match and help you decide. Measurement done properly, data in one place and dashboards people use.
We define what is measured and how, set it up properly and bring it together in one place. Every figure with its definition and its source, so management, marketing and sales talk about the same thing.
Example: one month of leadsEach dot is a real lead. Each tool counts it its own way: ads double count, analytics misses whoever rejects cookies and the CRM does not know where it came from.
Example of one month with the same leads: the ads count 120, analytics 84 and the CRM 61. With the same definitions, the figure is 64 in all of them.
When it makes sense
Sound familiar?
Every tool gives a different number.
There are reports, but nobody decides with them.
You cannot tell which channel brings customers.
The data is scattered everywhere.
What we build
Four parts, from definition to decision.
First we agree what each figure means. Without that, any dashboard is an argument.
01Measurement plan
First, what each figure means.
We agree what counts as a visit, an enquiry, an opportunity and a customer, and which actions are measured. Then we set it up with Google Tag Manager, GA4 and the ad platforms, respecting consent.
- What we deliver
- A written measurement plan, tagging validated in production and compliant consent.
- You see it in
- Measurement plan coverage.
02Traceability
Know where every customer comes from.
Every enquiry keeps its source from the first click to the sale: campaign, search, referral or call. Sales flow back to Google and Meta so campaigns learn from real customers.
- What we deliver
- Source recorded in the CRM and sales conversions sent back to the platforms.
- You see it in
- Sales with a known source.
03Unified information
The data in one place.
We bring website, ads, CRM and invoicing together in a common base, with the same definitions for every department.
- What we deliver
- Connected sources with automatic updates and a record of each one's last sync.
- You see it in
- Gap between platforms and CRM.
04Dashboards
Few figures, each leading to a decision.
One dashboard per area and a monthly review that ends with the decisions it produces. Including the line on what could not be known.
- What we deliver
- A dashboard in use and a monthly review with management.
- You see it in
- Decisions taken at each review.
How it is measured
We measure the measurement too. If a figure cannot be trusted, we say so.
- Plan coveragePlanned actions validated in production out of the total planned.
- Gap between platforms and CRMThe difference between the conversions ads report and the real enquiries in the CRM.
- Sales with a known sourceThe share of customers whose source channel is known.
- Decisions per reviewChanges agreed on the basis of the report. A report that decides nothing is not needed.
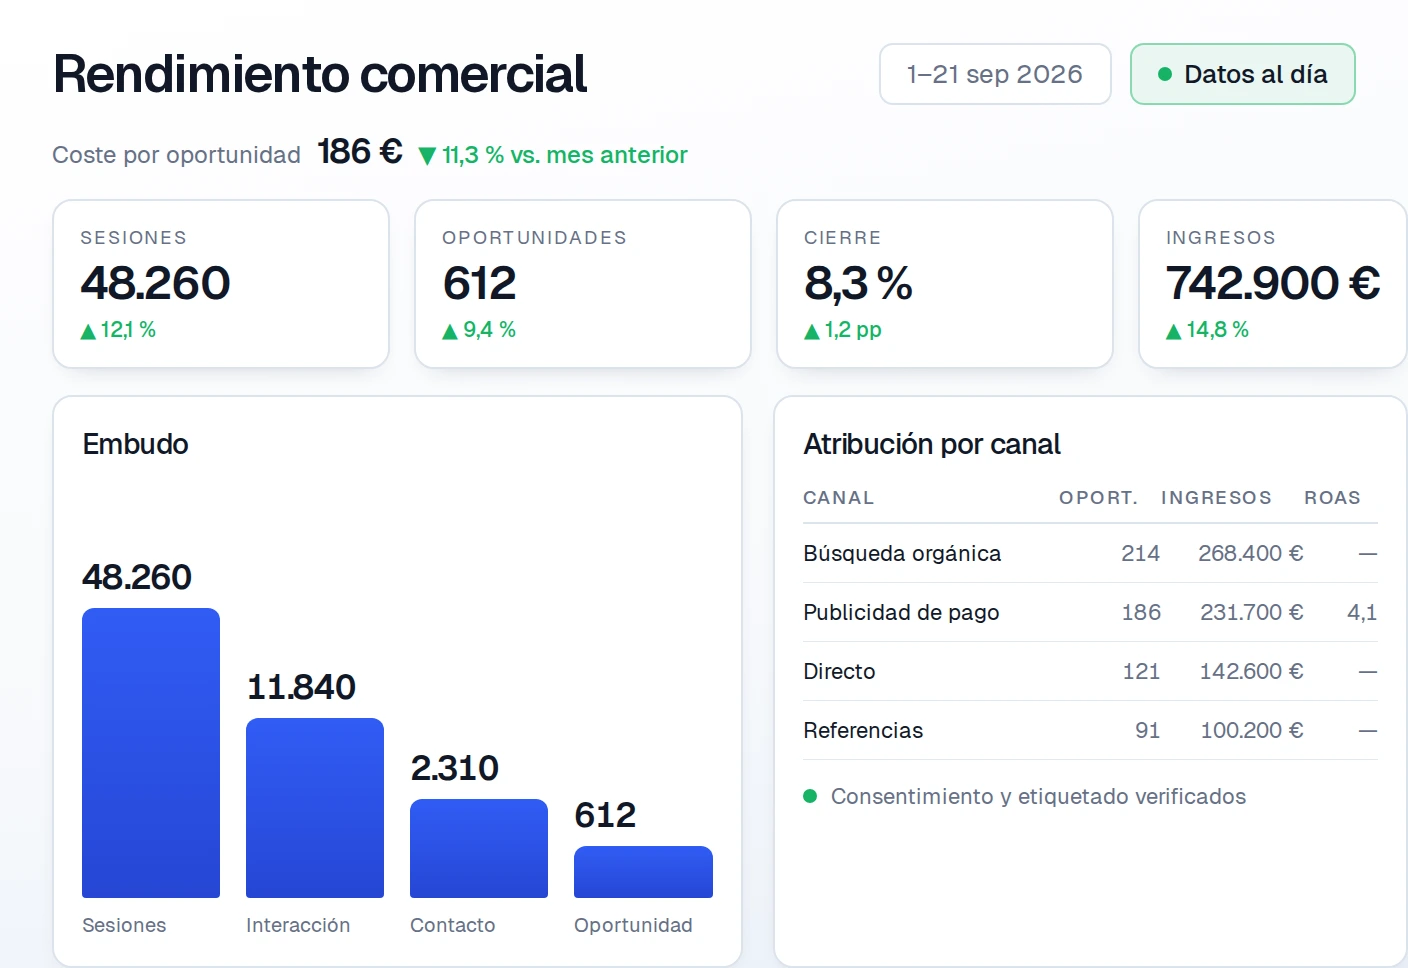
Monthly report (Example): Plan coverage 100%; Gap between platforms and CRM 3%; Sales with a known source 92%; Decisions per review 4. No consent: 22%. Visitors who reject cookies are not recorded in analytics. We estimate that share and state its weight in every report.
What it is built with
The services involved.
Each project combines the ones it needs, not all of them.

The other two areas
Start a project
Tell us about your situation. We reply with a reading of your case.
We do not send a closed proposal. First we understand what is happening, then we tell you what we would do and in what order.
- Reply within 24 working hours
- First one-hour call at no cost
- We work with companies across Spain